LinkedIn post format: what 958 tracked posts actually show
You want to know which LinkedIn post format gets the most engagement. Most advice out there relies on informal observations or LinkedIn's own publications, and LinkedIn has every reason to push video. Here's what the actual numbers look like across 958 posts measured on 5 active LinkedIn accounts from December 2020 to September 2026.
Methodology: what these numbers measure
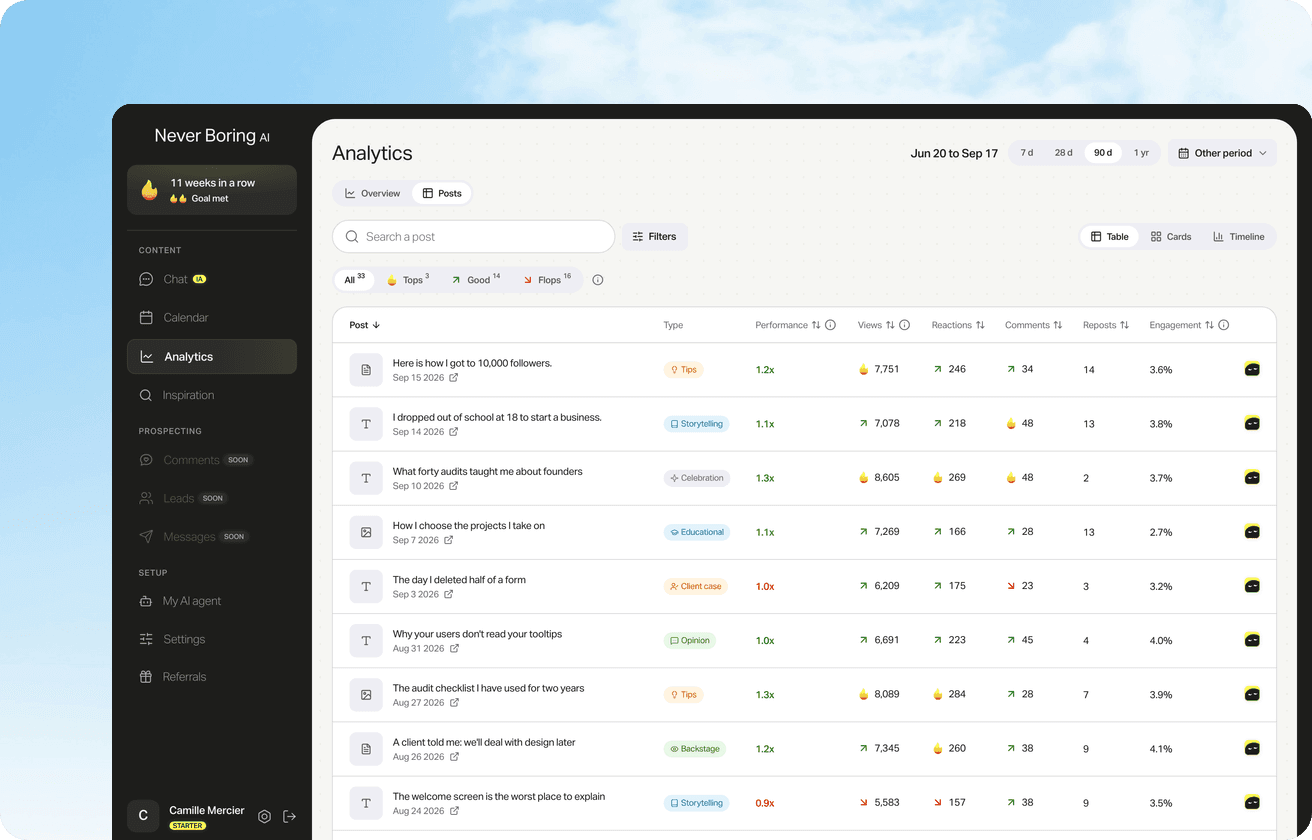
The data comes from 958 LinkedIn posts with full stats, on 5 active accounts tracked in Never Boring AI between December 2020 and September 2026 (Never Boring AI internal data, September 2026). Each post is classified by format as declared by LinkedIn: text, image, document (carousel), video. The metrics used are reactions (likes and others), comments and impressions. Reposts are excluded. Impressions are those declared by LinkedIn Analytics, not estimates.
Numbers by format
Here are the averages across the full period: → Video (75 posts): 124 reactions, 31 comments, 3,254 impressions on average. → Image (662 posts): 70 reactions, 20 comments, 3,975 impressions on average. → Document / carousel (89 posts): 58 reactions, 14 comments, 3,462 impressions on average. → Text only (132 posts): 36 reactions, 7 comments, 2,430 impressions on average. Source: linkedin_stats_posts, Never Boring AI, 958 posts measured on 5 active accounts, December 2020 - September 2026.
What averages don't show
Video wins on reactions, but image wins on impressions. An image post is seen by more people on average (3,975 vs 3,254 for video). This is partly explained by 662 image posts vs 75 videos: the 5 tracked accounts publish far more in image format, and their most active audiences are used to it. Video gets more reactions because it creates more engagement when it lands, not necessarily because it gets wider distribution.
Carousel (document) is also more nuanced than it looks. It gets 58 reactions and 3,462 impressions, lower than image on both metrics. Guides presenting carousel as LinkedIn's king format rely on data from 2021-2023, when the algorithm actively boosted it. In 2026, across these 5 accounts, image leads carousel.
What this means in practice
For a solopreneur or freelance publishing alone, the useful hierarchy is: image is the format to master first (volume, impressions, decent reactions, solo-produceable). Video is worth the investment if you make it regularly and your audience responds to it. Carousel justifies its production time only when the content cannot be said in one image or text. Text only remains valid for posts with strong narrative anchoring, where a visual adds nothing.
What Never Boring AI does with this data
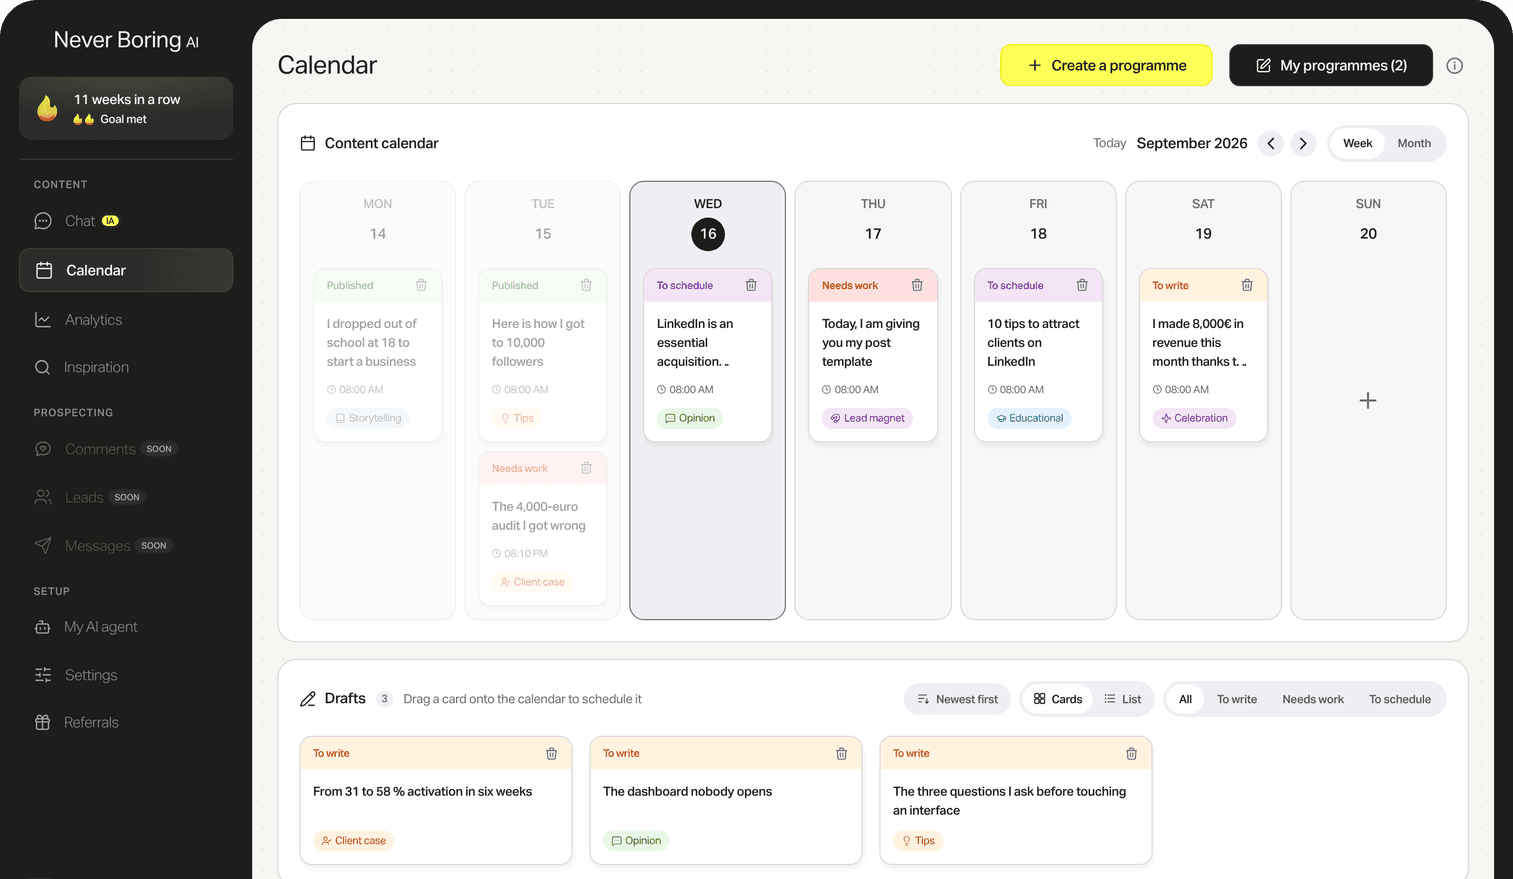
When you activate results tracking in Never Boring AI, the tool pulls your LinkedIn stats post by post. You see your own averages by format, not just general benchmarks. If your text-only posts outperform your images, it's your profile that matters, not the 5-account average above. The stats are there to calibrate your strategy on your audience, not to replicate what works in general.
Track your LinkedIn results in Never Boring AI
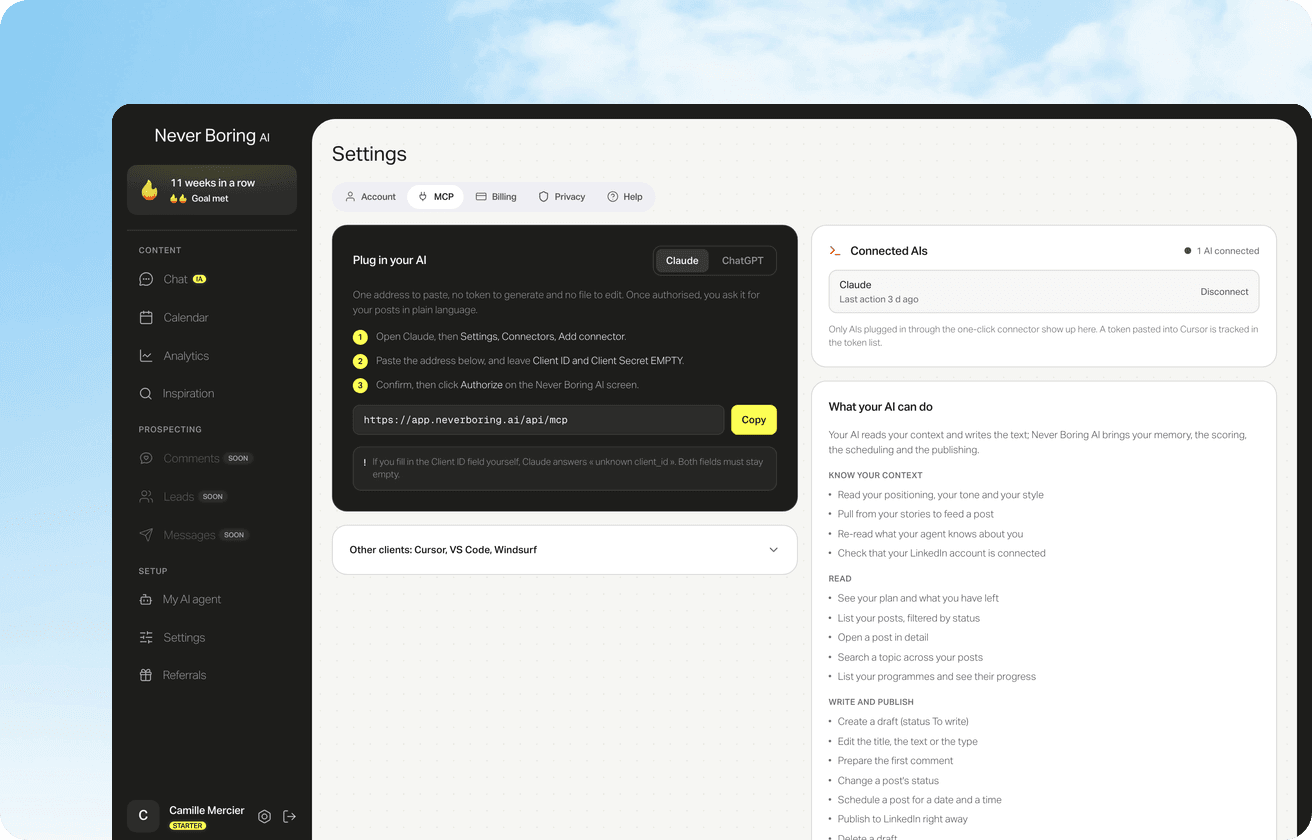
Results tracking is included in both plans. Connect your LinkedIn account once, and Never Boring AI pulls impressions, reactions and comments for each post. You see what works on your audience, not a general average.
Video leads with 124 reactions on average, ahead of image (70), document (58) and text (36). These figures come from 958 posts measured on 5 active accounts between 2020 and 2026 (Never Boring AI internal data).
Read next
50% off your first month
Create your account and walk away with your first post in minutes. Your LinkedIn calendar then runs on its own.


Already used by
202 founders